Note
Go to the end to download the full example code or to run this example in your browser via Binder
Matplotlib colormaps in Nilearn#
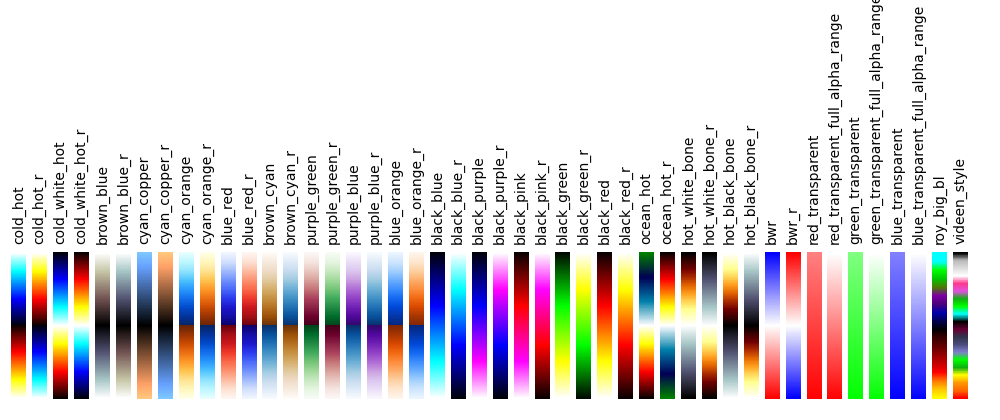
Visualize HCP connectome workbench color maps shipped with Nilearn which can be used for plotting brain images on surface.
See Surface plotting for surface plotting details.
Plot color maps#
try:
    import matplotlib.pyplot as plt
except ImportError:
    raise RuntimeError("This script needs the matplotlib library")

import numpy as np

from nilearn.plotting import show
from nilearn.plotting.cm import _cmap_d as nilearn_cmaps

nmaps = len(nilearn_cmaps)
a = np.outer(np.arange(0, 1, 0.01), np.ones(10))

# Initialize the figure
plt.figure(figsize=(10, 4.2))
plt.subplots_adjust(top=0.4, bottom=0.05, left=0.01, right=0.99)

for index, cmap in enumerate(nilearn_cmaps):
    plt.subplot(1, nmaps + 1, index + 1)
    plt.imshow(a, cmap=nilearn_cmaps[cmap])
    plt.axis("off")
    plt.title(cmap, fontsize=10, va="bottom", rotation=90)
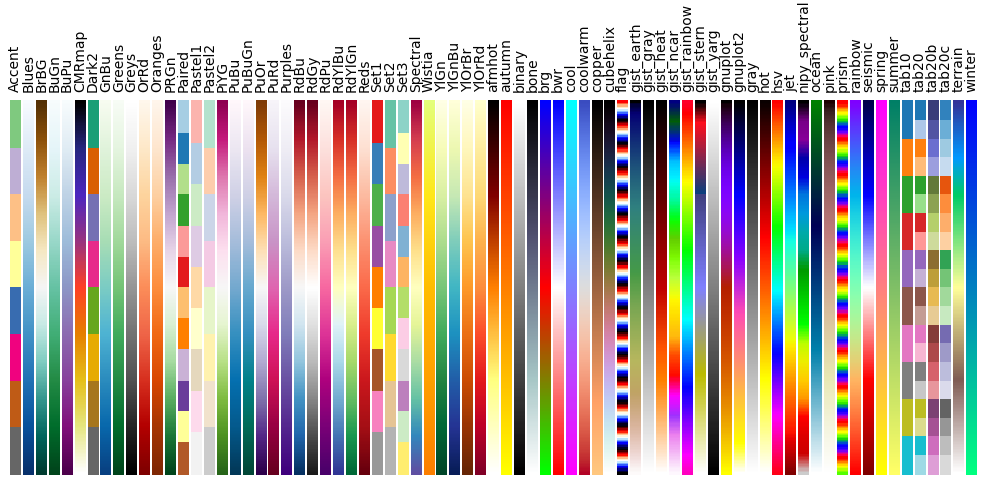
Plot matplotlib color maps#
plt.figure(figsize=(10, 5))
plt.subplots_adjust(top=0.8, bottom=0.05, left=0.01, right=0.99)
deprecated_cmaps = ["Vega10", "Vega20", "Vega20b", "Vega20c", "spectral"]
m_cmaps = [
    m
    for m in plt.cm.datad
    if not m.endswith("_r") and m not in deprecated_cmaps
]
m_cmaps.sort()

for index, cmap in enumerate(m_cmaps):
    plt.subplot(1, len(m_cmaps) + 1, index + 1)
    plt.imshow(a, cmap=plt.get_cmap(cmap), aspect="auto")
    plt.axis("off")
    plt.title(cmap, fontsize=10, va="bottom", rotation=90)

show()
Total running time of the script: (0 minutes 4.813 seconds)
Estimated memory usage: 17 MB