Note
Go to the end to download the full example code or to run this example in your browser via Binder
Show stimuli of Haxby et al. dataset#
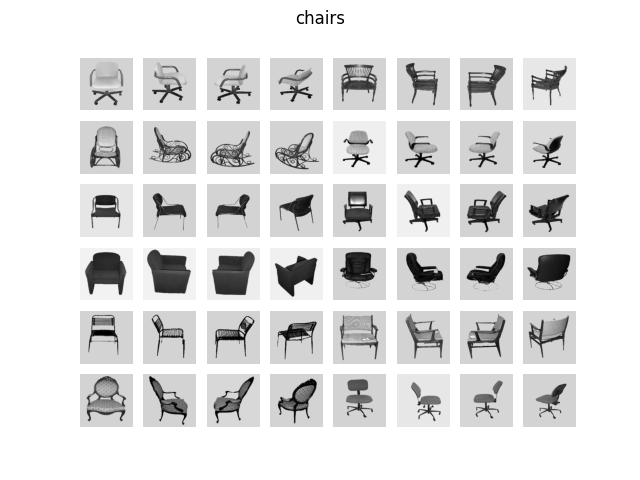
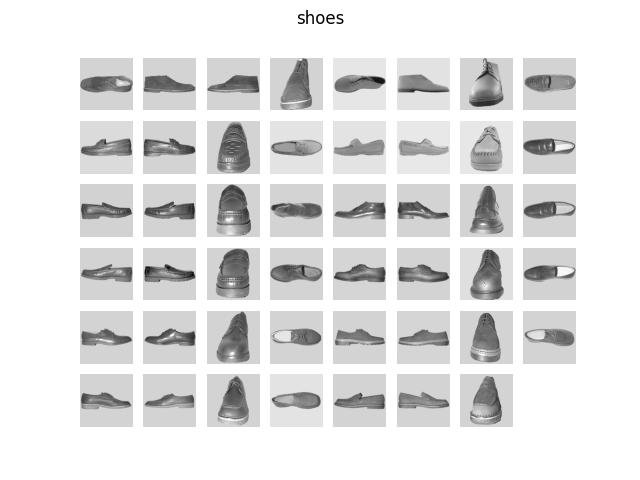
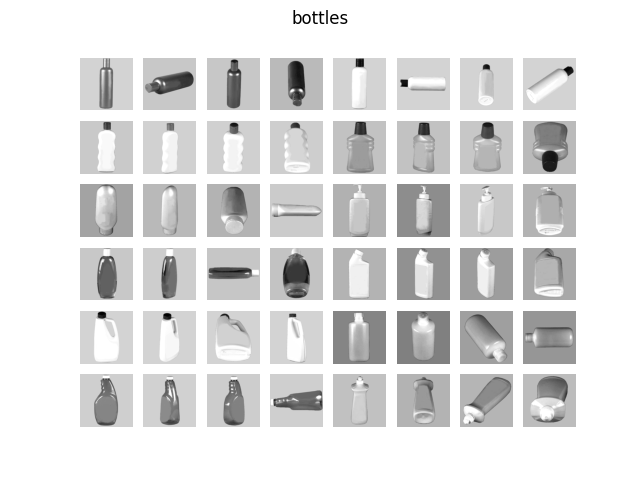
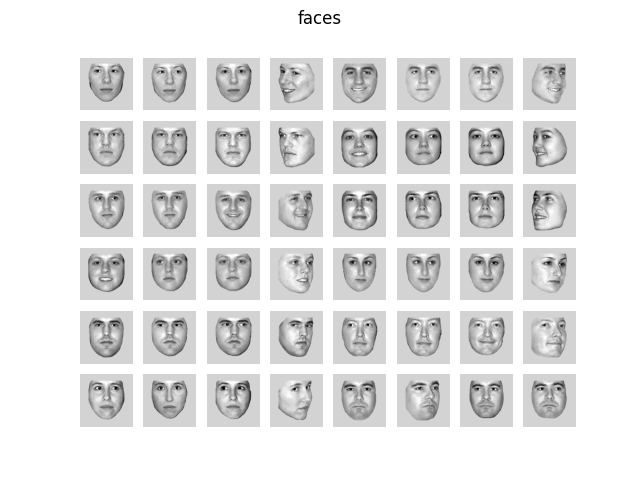
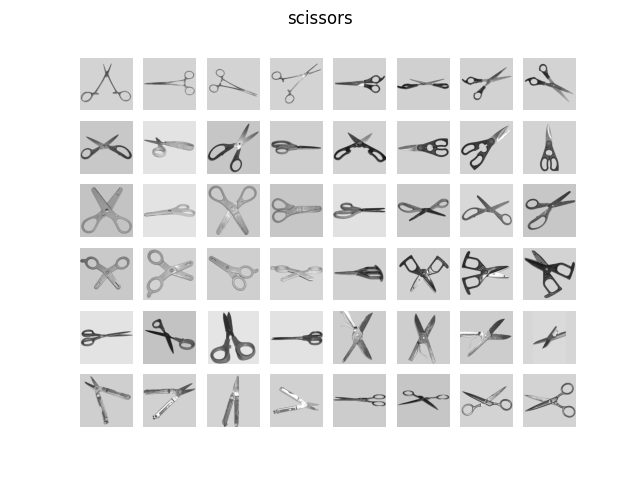
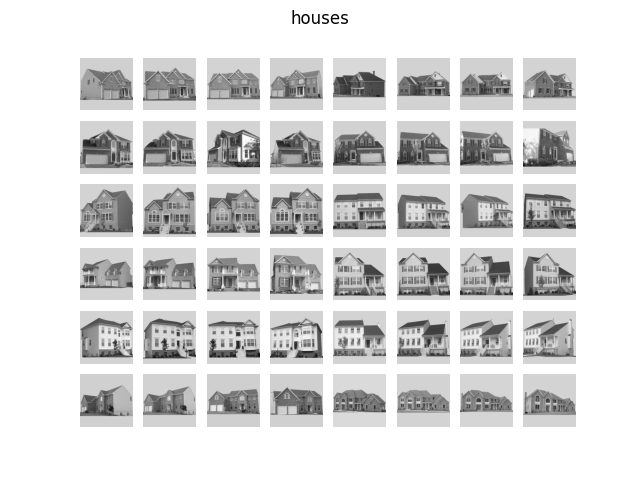
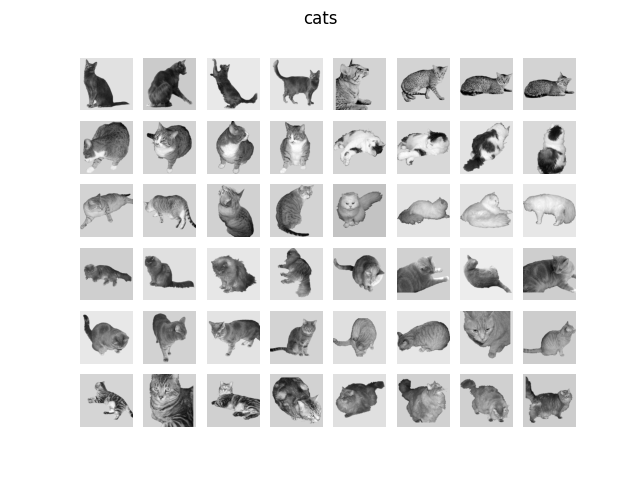
In this script we plot an overview of the stimuli used in “Distributed and Overlapping Representations of Faces and Objects in Ventral Temporal Cortex” (Science 2001)
import matplotlib.pyplot as plt

from nilearn import datasets
from nilearn.plotting import show

haxby_dataset = datasets.fetch_haxby(subjects=[], fetch_stimuli=True)
stimulus_information = haxby_dataset.stimuli
Downloading data from http://data.pymvpa.org/datasets/haxby2001/stimuli-2010.01.14.tar.gz ...

Downloaded 622592 of 10463676 bytes (6.0%,   16.2s remaining)
Downloaded 1523712 of 10463676 bytes (14.6%,   12.0s remaining)
Downloaded 2523136 of 10463676 bytes (24.1%,    9.6s remaining)
Downloaded 3571712 of 10463676 bytes (34.1%,    7.9s remaining)
Downloaded 4562944 of 10463676 bytes (43.6%,    6.6s remaining)
Downloaded 5619712 of 10463676 bytes (53.7%,    5.2s remaining)
Downloaded 6709248 of 10463676 bytes (64.1%,    4.0s remaining)
Downloaded 7929856 of 10463676 bytes (75.8%,    2.6s remaining)
Downloaded 9314304 of 10463676 bytes (89.0%,    1.1s remaining) ...done. (10 seconds, 0 min)
Extracting data from /home/remi/nilearn_data/haxby2001/5cd78c74b711572c7f41a5bddb69abca/stimuli-2010.01.14.tar.gz..... done.
for stim_type in stimulus_information:
    # skip control images, there are too many
    if stim_type != "controls":
        file_names = stimulus_information[stim_type]

        fig, axes = plt.subplots(6, 8)
        fig.suptitle(stim_type)

        for img_path, ax in zip(file_names, axes.ravel()):
            ax.imshow(plt.imread(img_path), cmap=plt.cm.gray)

        for ax in axes.ravel():
            ax.axis("off")

show()
Total running time of the script: (0 minutes 16.621 seconds)
Estimated memory usage: 12 MB
