Note
Go to the end to download the full example code or to run this example in your browser via Binder
Basic numerics and plotting with Python#
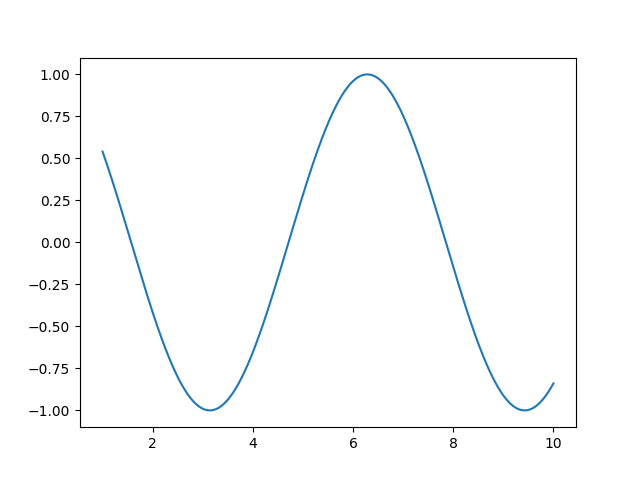
A simple example of basic Python numerics and how to plot it.

[<matplotlib.lines.Line2D object at 0x7f5a710ae690>]
Total running time of the script: (0 minutes 0.972 seconds)
Estimated memory usage: 9 MB