Note
This page is a reference documentation. It only explains the function signature, and not how to use it. Please refer to the user guide for the big picture.
nilearn.plotting.plot_matrix#
- nilearn.plotting.plot_matrix(mat, title=None, labels=None, figure=None, axes=None, colorbar=True, cmap=<matplotlib.colors.LinearSegmentedColormap object>, tri='full', auto_fit=True, grid=False, reorder=False, **kwargs)[source]#
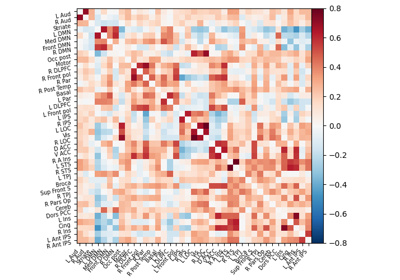
Plot the given matrix.
- Parameters
- mat2-D
numpy.ndarray Matrix to be plotted.
- title
str, or None, optional The title displayed on the figure. Default=None.
- labels
list, ornumpy.ndarrayofstr, or False, or None, optional The label of each row and column. Needs to be the same length as rows/columns of mat. If False, None, or an empty list, no labels are plotted.
- figure
matplotlib.figure.Figure, figsizetuple, or None, optional Sets the figure used. This argument can be either an existing figure, or a pair (width, height) that gives the size of a newly-created figure.
Note
Specifying both axes and figure is not allowed.
- axesNone or
matplotlib.axes.Axes, optional Axes instance to be plotted on. Creates a new one if None.
Note
Specifying both axes and figure is not allowed.
- colorbar
bool, optional If
True, display a colorbar on the right of the plots. Default=True.- cmap
matplotlib.colors.Colormap, orstr, optional The colormap to use. Either a string which is a name of a matplotlib colormap, or a matplotlib colormap object. Default=`plt.cm.RdBu_r`.
- tri{‘full’, ‘lower’, ‘diag’}, optional
Which triangular part of the matrix to plot:
‘lower’: Plot the lower part
‘diag’: Plot the lower part with the diagonal
‘full’: Plot the full matrix
Default=’full’.
- auto_fit
bool, optional If auto_fit is True, the axes are dimensioned to give room for the labels. This assumes that the labels are resting against the bottom and left edges of the figure. Default=True.
- gridcolor or False, optional
If not False, a grid is plotted to separate rows and columns using the given color. Default=False.
- reorder
boolor {‘single’, ‘complete’, ‘average’}, optional If not False, reorders the matrix into blocks of clusters. Accepted linkage options for the clustering are ‘single’, ‘complete’, and ‘average’. True defaults to average linkage. Default=False.
Note
This option is only available with SciPy >= 1.0.0.
New in version 0.4.1.
- kwargsextra keyword arguments, optional
Extra keyword arguments are sent to pylab.imshow.
- mat2-D
- Returns
- display
matplotlib.axes.Axes Axes image.
- display
Examples using nilearn.plotting.plot_matrix#
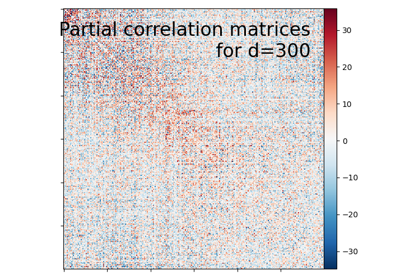
Visualizing Megatrawls Network Matrices from Human Connectome Project
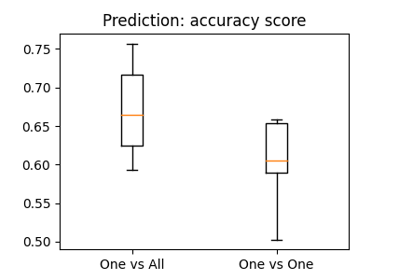
The haxby dataset: different multi-class strategies
Extracting signals of a probabilistic atlas of functional regions
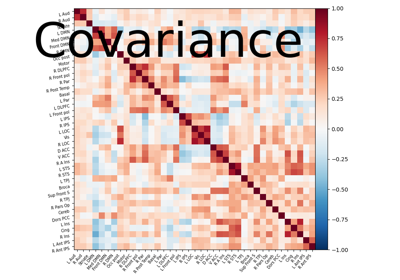
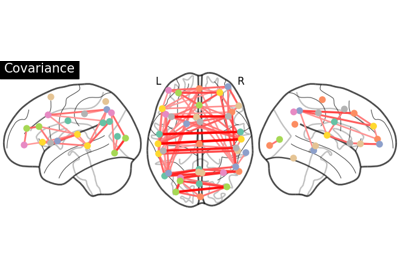
Computing a connectome with sparse inverse covariance
Connectivity structure estimation on simulated data
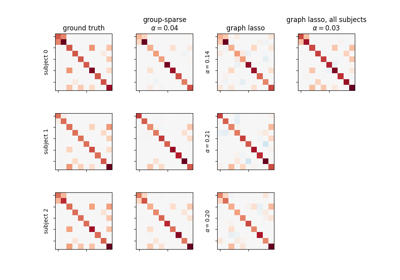
Group Sparse inverse covariance for multi-subject connectome
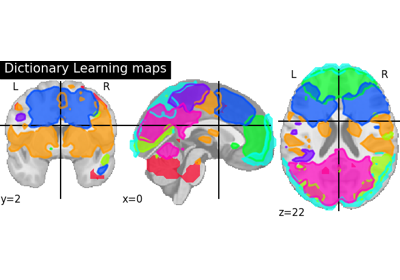
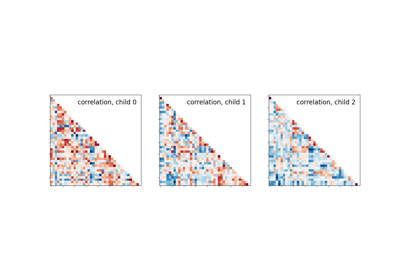
Regions extraction using dictionary learning and functional connectomes
Classification of age groups using functional connectivity